Bitcoin Drops Into Rainbow Chart's 'BTC Is Dead' Zone
Bitcoin has fallen below a key support band on the popular Rainbow Chart, entering territory historically labeled 'BTC is dead.'
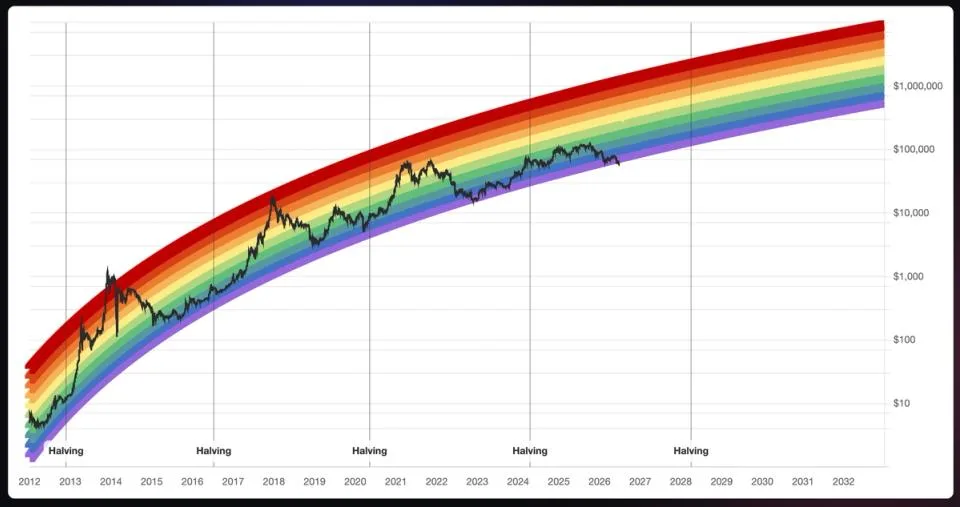
Bitcoin plunged below the floor of its widely followed Rainbow Chart this week, sliding into the ominous band that analysts have long labeled the 'BTC is dead' zone — a price territory that has historically marked extreme capitulation and maximum fear among retail investors. The move signals one of the most severe valuation collapses the flagship cryptocurrency has logged in recent memory against the chart's logarithmic regression model.
The Rainbow Chart is a long-running visual tool used by crypto analysts to contextualize Bitcoin's price cycles against a color-coded logarithmic curve. Each colored band carries a sentiment label, ranging from overheated 'maximum bubble territory' at the top to the deeply discounted 'BTC is dead' zone at the bottom. Breaking below that lowest band is an event that has occurred only a handful of times across Bitcoin's history, typically coinciding with prolonged bear markets or black-swan events.
Read more Brent Crude Breaks $100 as Goldman Eyes $120 Next →
For longer-term holders, prior breaches of the chart's floor have paradoxically served as contrarian buy signals, given that such extreme pessimism has historically preceded significant recoveries. However, analysts caution that past performance on a heuristic chart does not guarantee a rebound, and macro headwinds — including elevated interest rates and tightening liquidity — continue to pressure risk assets broadly.
The psychological weight of breaching this threshold is significant for retail sentiment. Social media chatter around Bitcoin's death has historically spiked during these episodes, amplifying selling pressure before any stabilization takes hold. Whether this breakdown marks a generational buying opportunity or the start of a deeper drawdown remains the central debate across crypto trading communities right now.
Continue reading at CoinDesk.